

Monitoring machine learning training runs demands a strategic dashboard layout because logs, loss curves, metrics, and hardware telemetry compete for limited screen space. Frequent tab switching creates a real "Toggle Tax" that can cause you to miss transient stalls, gradient explosions, or memory spikes during long sessions. High-resolution displays that support multiple full-sized windows simultaneously reduce this friction by enabling visual parity, where you can correlate cause and effect without moving your mouse. The right layout depends on your dominant data stream: choose ultrawide for metrics-heavy workflows, a vertical monitor for log-heavy NLP or LLM jobs, or balanced 4K for mixed production runs. Prioritizing visual hierarchy over maximizing window count keeps cognitive load manageable, and simple firmware tweaks like lowering local dimming can prevent distracting blooming in dark terminal environments.

Why ML Training Monitoring Demands a Strategic Dashboard Layout
Long-running ML jobs generate massive, concurrent data streams that quickly overwhelm a standard 1080p monitor. Logs scroll continuously with stack traces and timestamps, loss curves require horizontal width to distinguish stochastic noise from real divergence, and GPU telemetry needs to remain glanceable without dominating the view. The Toggle Tax—the cognitive and physical cost of switching between tabs or windows—is more than an annoyance. In late-night training runs it raises the risk of missing critical warnings that could waste hours or days of compute.
High-resolution setups (4K, 5K, or ultrawide) address this by allowing four or more readable windows at once. This creates visual parity, letting you see a spike in VRAM alongside the corresponding log error and the flattening loss curve in a single glance. The benefit is faster detection of issues and lower monitoring friction, not any direct improvement in final model accuracy. Data scientists and ML engineers running production jobs or research experiments therefore benefit most when their display real estate matches the three core data types they must monitor simultaneously.
Mapping Your Monitoring Workflow: Logs, Metrics, and Hardware Stats
Effective layouts start with clearly separating the three primary data streams. Logs are vertical, text-heavy streams that benefit from depth so you can scroll back through temporal context and full stack traces without line wrapping. Metrics, such as loss or accuracy curves, are horizontal graph data that need sufficient width to reveal trends rather than noise. Hardware telemetry—GPU utilization, VRAM, temperature, and power draw—should occupy only a small, always-visible area as compact sparklines or single-value readouts.
Side-by-side visualization of logs and metrics is a recognized best practice for root-cause analysis. As Grafana's Explore documentation explains, correlating metrics and logs in the same view helps identify why a training stall occurred. Real-time hardware tools like nvidia-smi or nvtop supply the third layer. When these three elements can be seen together without resizing or switching, you reduce the chance of missing a memory overflow or a sudden gradient explosion. For most data scientists this mapping exercise—deciding which stream dominates their current project—is the first practical step before choosing hardware or arranging windows.
Layout Archetypes: From 'The Panorama' to 'The Vertical Pillar'
Different ML workflows favor different monitor geometries. Three common archetypes illustrate how hardware shape influences effective dashboard design.
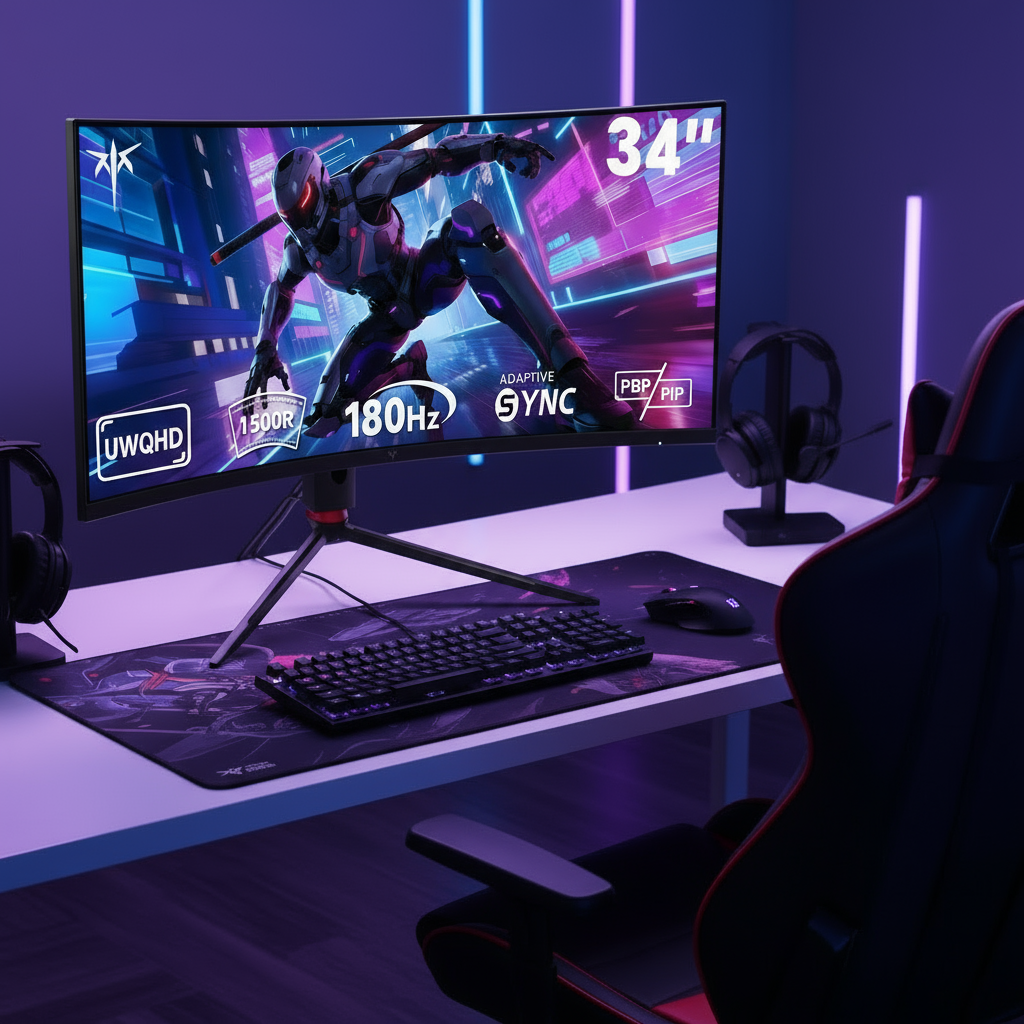
The Panorama uses a 32:9 ultrawide such as the KTC 49" DQHD 180Hz 1000R Curved Gaming monitor H49S66. A typical 20/50/30 split places hardware stats on the far left, the wide loss curve in the center, and the log tail on the right. This single-screen solution eliminates bezels and supports seamless correlation across wide graphs. It suits metrics-heavy computer vision or reinforcement learning runs but can involve more horizontal head movement.
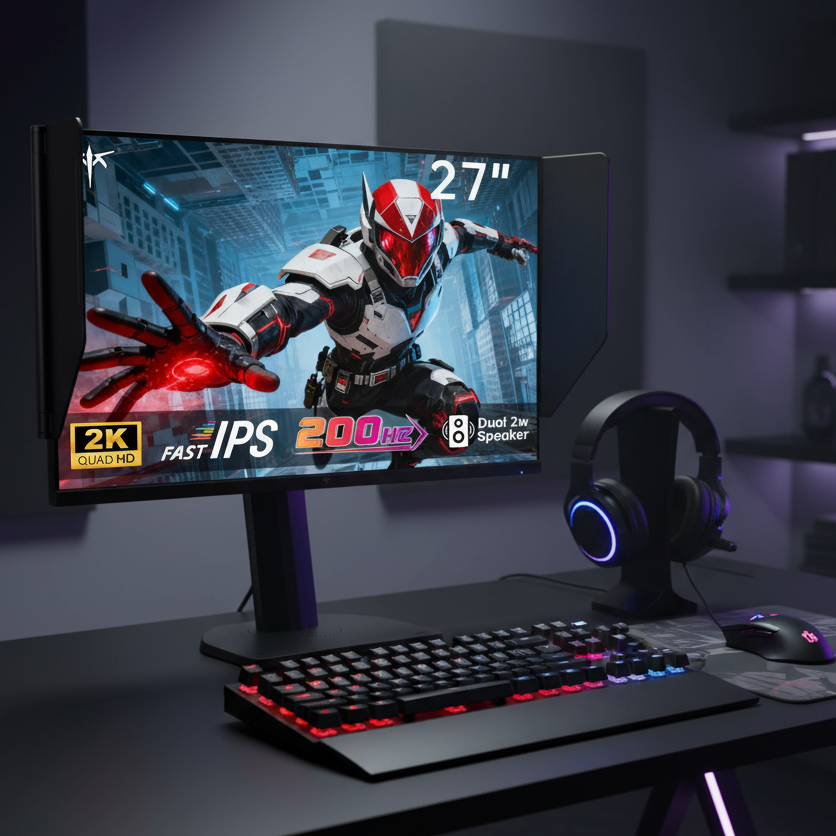
The Vertical Pillar shines for NLP and LLM training where logs are the primary debugging source. Rotating a pivot-capable 27-inch monitor like the KTC 27" 2K 300Hz/1ms Gaming Vertical Monitor H27E6 gives an "infinite" vertical log view while the top quarter holds a square loss curve. This archetype minimizes horizontal scrolling through deep error traces and is often paired with a second screen for metrics.
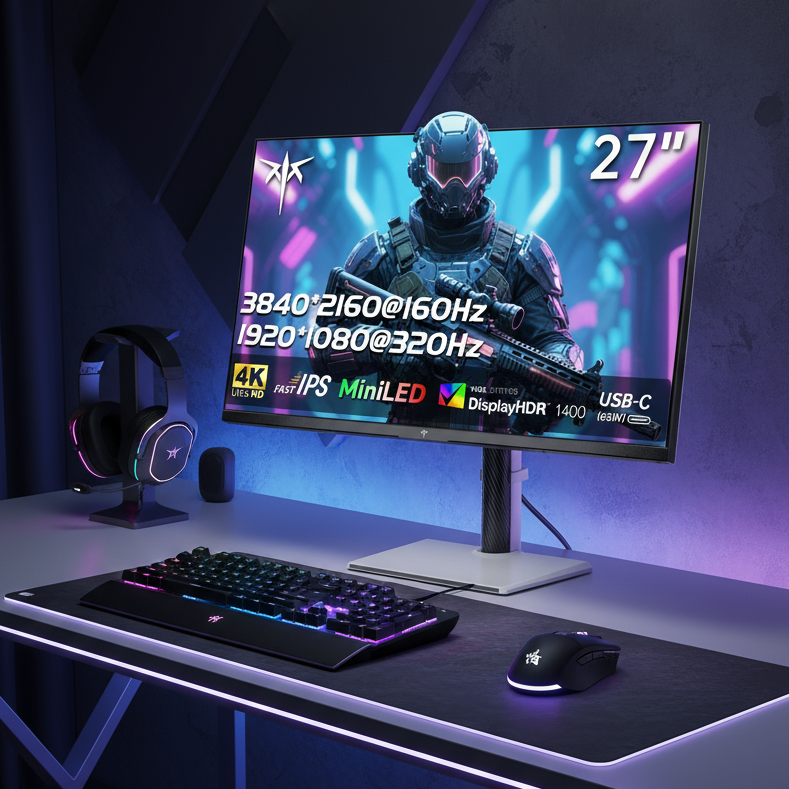
The Command Center approach uses dual 4K monitors. One screen remains stable with system health and training metrics; the second handles investigation with code, notebooks, and live logs. The KTC 27" 4K 160Hz/320Hz 90W Gaming Monitor H27P6 works well here because its dual-mode capability and full ergonomics let you quickly adjust between 4K detail and higher refresh when scrolling long logs. Choose the archetype that matches your dominant data type; switching archetypes later often requires only a stand adjustment or second panel rather than a full hardware replacement.

How to Allocate Windows for Maximum Information Density
Once you select a layout archetype, apply a visual hierarchy to prevent overload. Industry guidance suggests three priority levels. System health (L1) should consume less than 5 % of real estate as compact sparklines. Training metrics (L2) deserve 40–50 % because horizontal width is critical for trend detection. Log tailing (L3) requires vertical depth and should avoid aggressive line wrapping to preserve readability.
As outlined in Beluga AI's monitoring dashboard best practices, hierarchical organization reduces cognitive load during long sessions. Loss curves in particular need at least 1200 px of width to let you distinguish real divergence from normal stochastic behavior. Scale font sizes and window proportions according to criticality rather than trying to fit everything at equal size. A common regret is using tiny fonts across too many windows, leading to eye fatigue after several hours. Test your allocation by asking whether you can spot a sudden metric spike and the matching log line without resizing anything. If the answer is no, simplify the hierarchy before adding more panels.
Essential Tooling: Optimizing Log-Tailing with lnav and tmux
Software tools turn raw screen real estate into persistent, readable dashboards. Terminal multiplexers such as tmux allow you to create multi-pane layouts that survive SSH disconnects, making them essential for remote training jobs. As the official tmux wiki documents, you can split a single terminal into custom quadrants for code, logs, and live metrics that remain active even if the connection drops.
Advanced log navigators like lnav automatically merge multiple log streams into one chronological timeline and provide one-key jumping between errors. The lnav project site highlights the 'e' and 'E' hotkeys that instantly move between warnings and errors, dramatically cutting debug time. For users who prefer a dedicated ncurses interface, MultiTail offers color-coded, real-time monitoring of several files within a single terminal session.
These tools pair particularly well with high-resolution displays. The chart below visualizes how typical resolution tiers affect the number of simultaneous readable windows and the resulting monitoring friction in ML workflows.
Resolution Tiers and Monitoring Friction in ML Training
Higher resolution tiers typically allow more full-size windows at readable font sizes, reducing the need to toggle between views. Patterns shown are based on common workstation setups and reflect relative differences rather than measured lab results.
Show Data Table
| Resolution | Typical Toggle Actions per Check | Readable Windows at Once |
|---|---|---|
| 1080p | 6 | 2 |
| 4K | 3 | 4 |
| 5K | 1.5 | 6 |
| 32:9 Ultrawide | 2 | 5 |
The pattern clarifies that moving beyond 1080p usually cuts toggle actions in half while supporting more simultaneous views, helping you decide whether a resolution upgrade meaningfully reduces friction for your specific training workload.
Maintaining Visibility and Comfort During Long Training Sessions
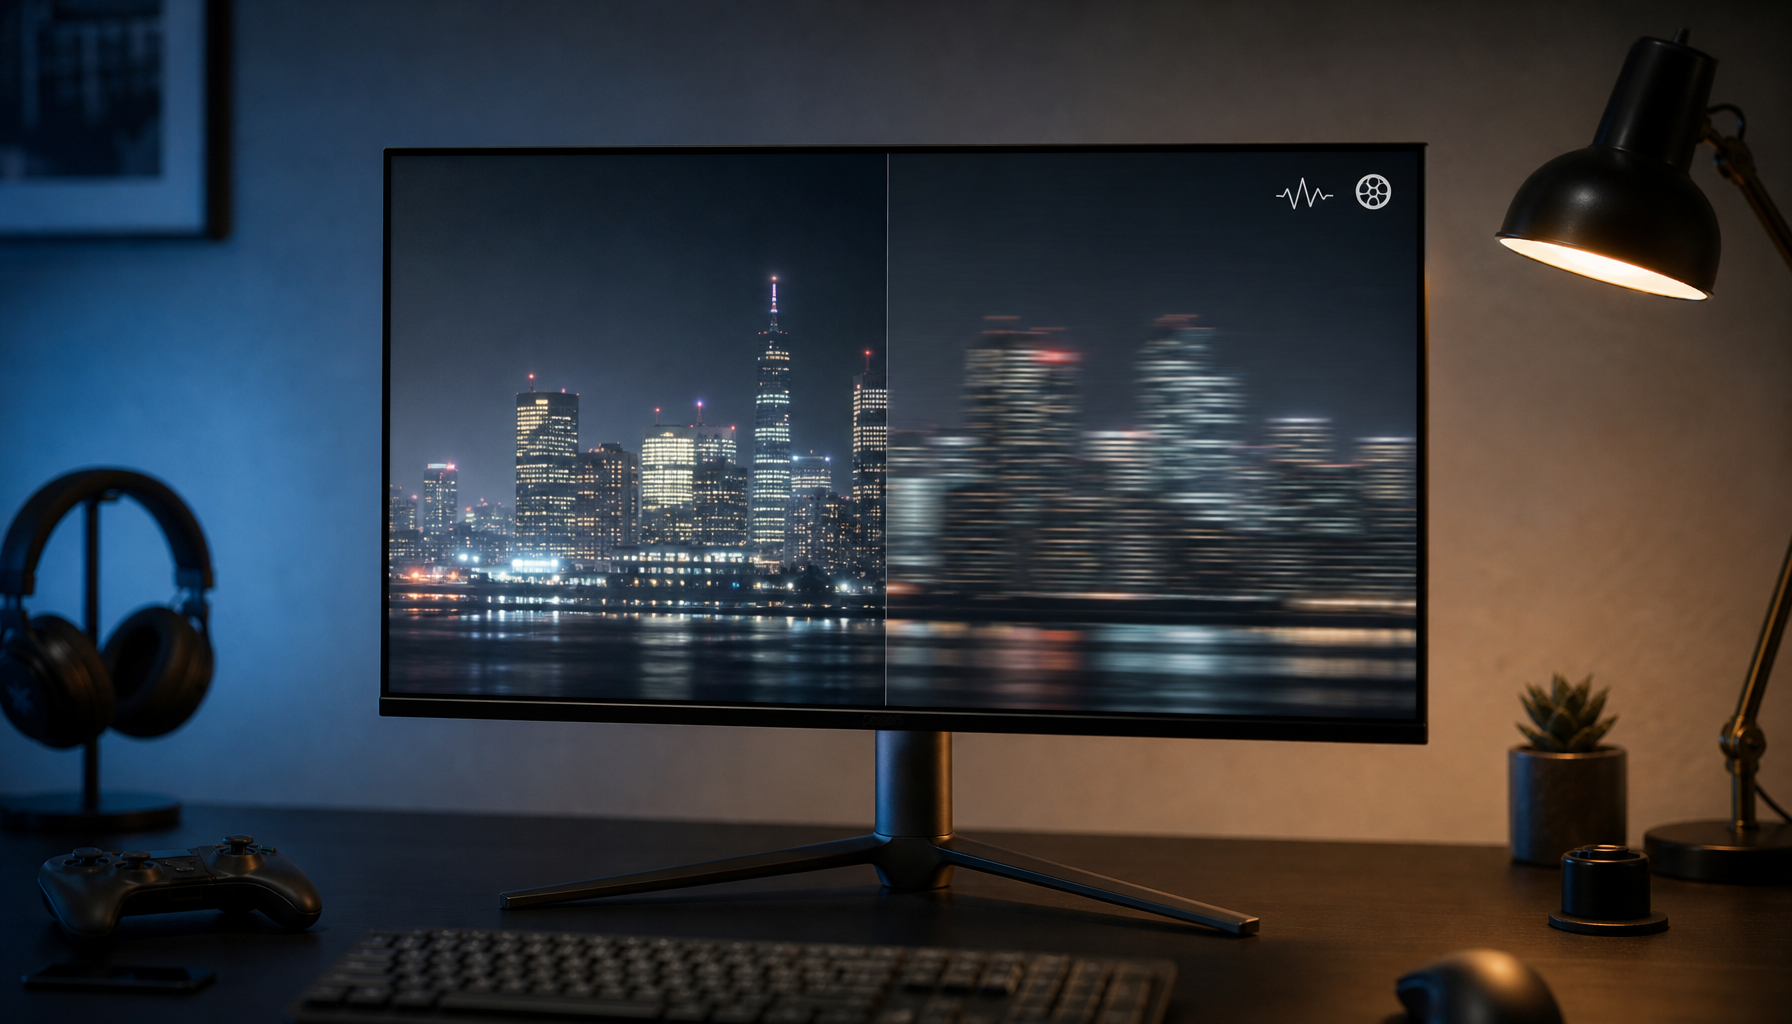
Eighteen-hour training runs expose ergonomic and visual comfort issues that short sessions hide. Mini-LED panels can produce halos around white terminal text in dark mode; many users therefore lower local dimming to "Low" or switch to a "Desktop Mode" firmware setting when logs dominate the screen. This adjustment trades some contrast for cleaner text readability without requiring you to abandon dark themes entirely.
Higher pixel density from 4K or 5K monitors, such as the KTC 27" 5K@60Hz 2K@120Hz Home&Office Monitor H27P3, lets you use smaller fonts while keeping text crisp, reducing the need to lean forward or enlarge windows. Although ML training is not competitive gaming, a 100 Hz or higher refresh rate—as found on the KTC 27" 2K 100Hz Monitor H27T27—makes scrolling through thousands of log lines feel noticeably smoother and lowers perceived eye strain over multi-hour sessions.
Not every setup fits every environment. If your desk space is very compact or you primarily run short experiments that finish in under an hour, the added cost and desk footprint of ultrawide or dual 4K may deliver diminishing returns. In those cases a single high-quality 27-inch 4K monitor with good ergonomics often suffices. The key self-check is whether you can maintain full visibility of your critical three data streams for the expected run length without physical discomfort or frequent window management.
Audit Your Setup: A Step-by-Step Layout Implementation Guide
Implementing a new dashboard takes less than an hour once you know the critical data streams. Begin by mapping your "Critical Three"—logs, curves, and stats—against your current screen real estate and decide which archetype best matches. Next configure tmux or your preferred multiplexer to create persistent panes that survive disconnects. Open your loss-curve visualizer, hardware monitor, and log navigator in the allocated zones, then run a short test job.
The final validation step is the visual-parity test: can you see both a sudden metric divergence and the matching log error without touching the mouse or keyboard? If yes, your layout is ready for production runs. If not, adjust window proportions or resolution before the next long job. Many engineers also add simple alerts or desktop notifications for critical thresholds so they can step away briefly without losing oversight. This quick audit process turns ad-hoc window tiling into a repeatable, low-friction workflow that scales with longer and more complex training experiments.
How Does Local Dimming Affect Terminal Readability in Dark Mode?
Local dimming on Mini-LED monitors improves contrast for graphs but can create halos around bright text on dark backgrounds. For log-heavy sessions, setting dimming to Low or using a dedicated Desktop Mode usually restores readability while retaining enough contrast for metrics. Test your specific model because blooming severity varies with firmware version and room lighting.
Should I Use a Single Ultrawide or Dual Monitors for ML Monitoring?
Single ultrawide panels eliminate bezels and simplify cable management, which many find cleaner for metrics-plus-logs workflows. Dual monitors offer independent brightness and orientation control, which can be preferable when one screen stays dedicated to stable telemetry and the other handles dynamic investigation. The choice usually comes down to whether your primary debugging happens within one continuous canvas or across clearly separated tasks.
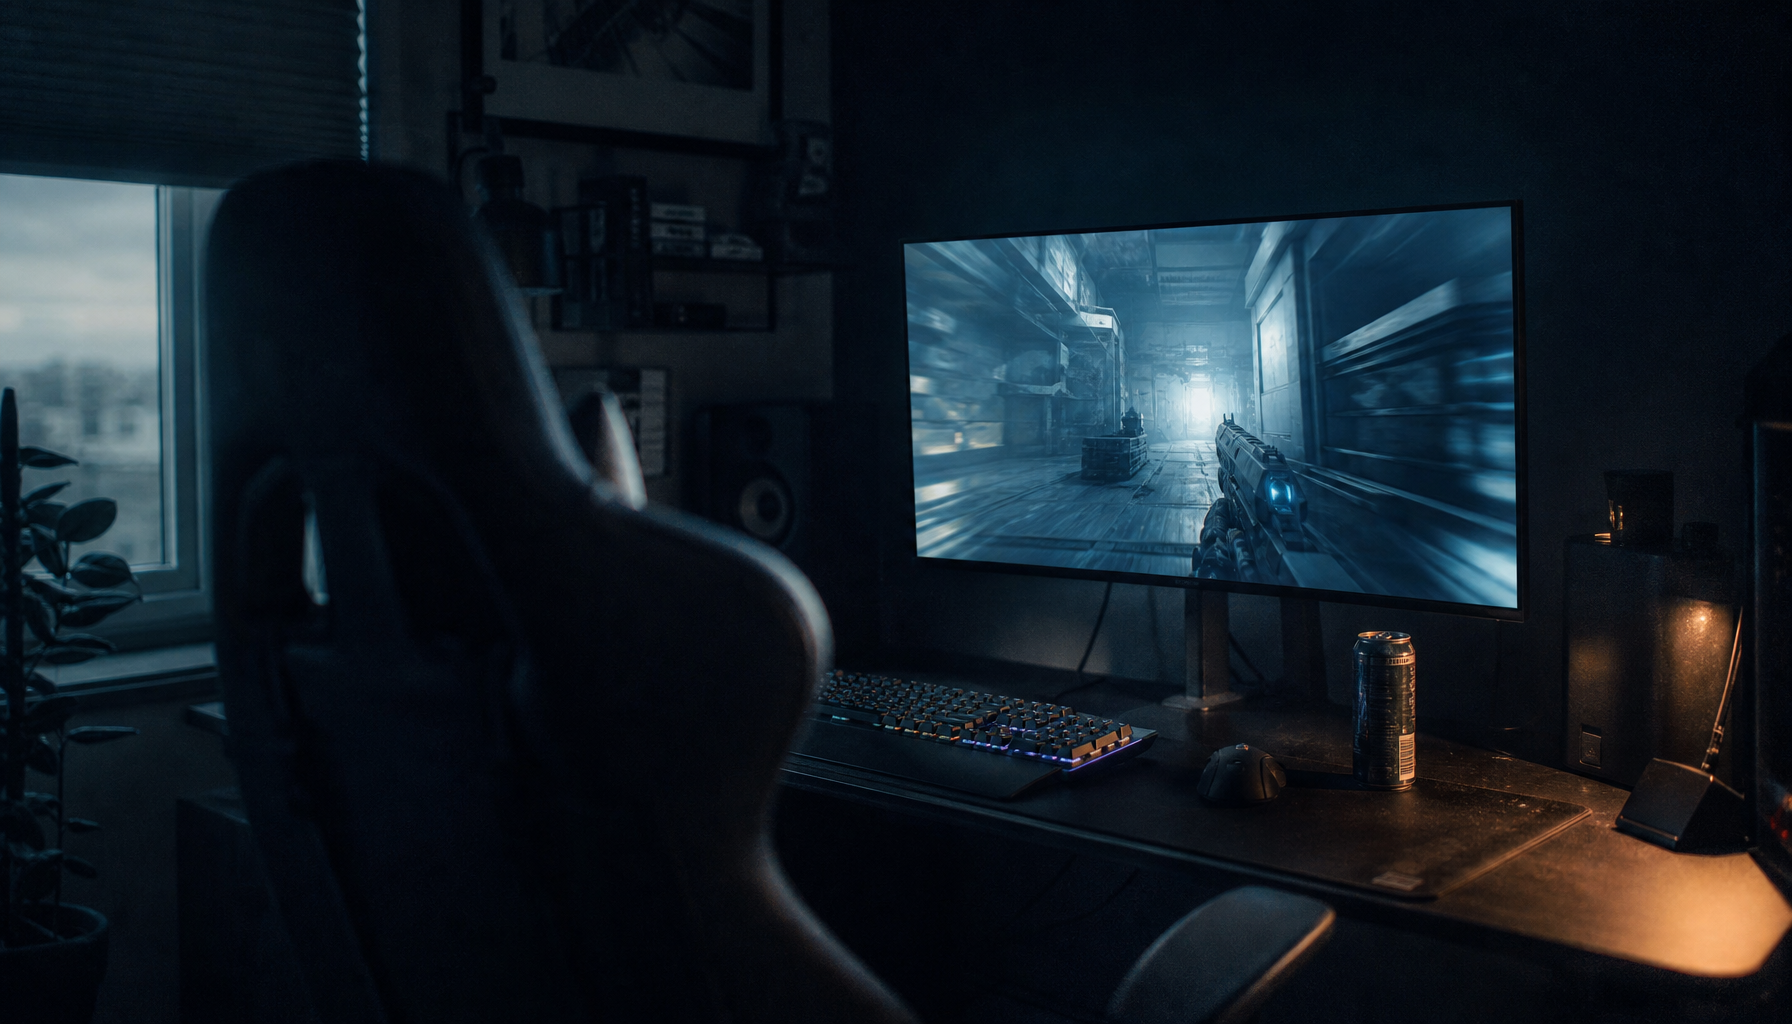
What Refresh Rate Is Sufficient for Scrolling Long Log Files?
While ML training does not require esports-level speed, 100 Hz or higher makes rapid scrolling through thousands of log lines feel smoother and reduces perceived judder. Below 75 Hz the difference becomes noticeable during extended debugging. Most modern office and mixed-use monitors in the 100–160 Hz range already exceed the practical requirement for log tailing.
Can I Effectively Monitor Training on a Laptop Screen Alone?
A high-quality laptop screen can handle short runs or initial experiments, but most practitioners find that adding even one external high-resolution monitor dramatically lowers the Toggle Tax once jobs exceed a few hours. The limited vertical and horizontal real estate on typical laptops forces constant resizing or tab switching that quickly becomes fatiguing during production training.
How Do I Future-Proof My Dashboard Layout for Larger Models?
As models grow, log volume and metric complexity tend to increase. Investing in a monitor with strong ergonomics, high pixel density, and flexible inputs (USB-C with power delivery, DisplayPort) gives you room to add vertical real estate or additional panes without replacing the entire setup. Periodically revisiting your visual hierarchy ensures that new data streams do not push critical alerts out of view.


